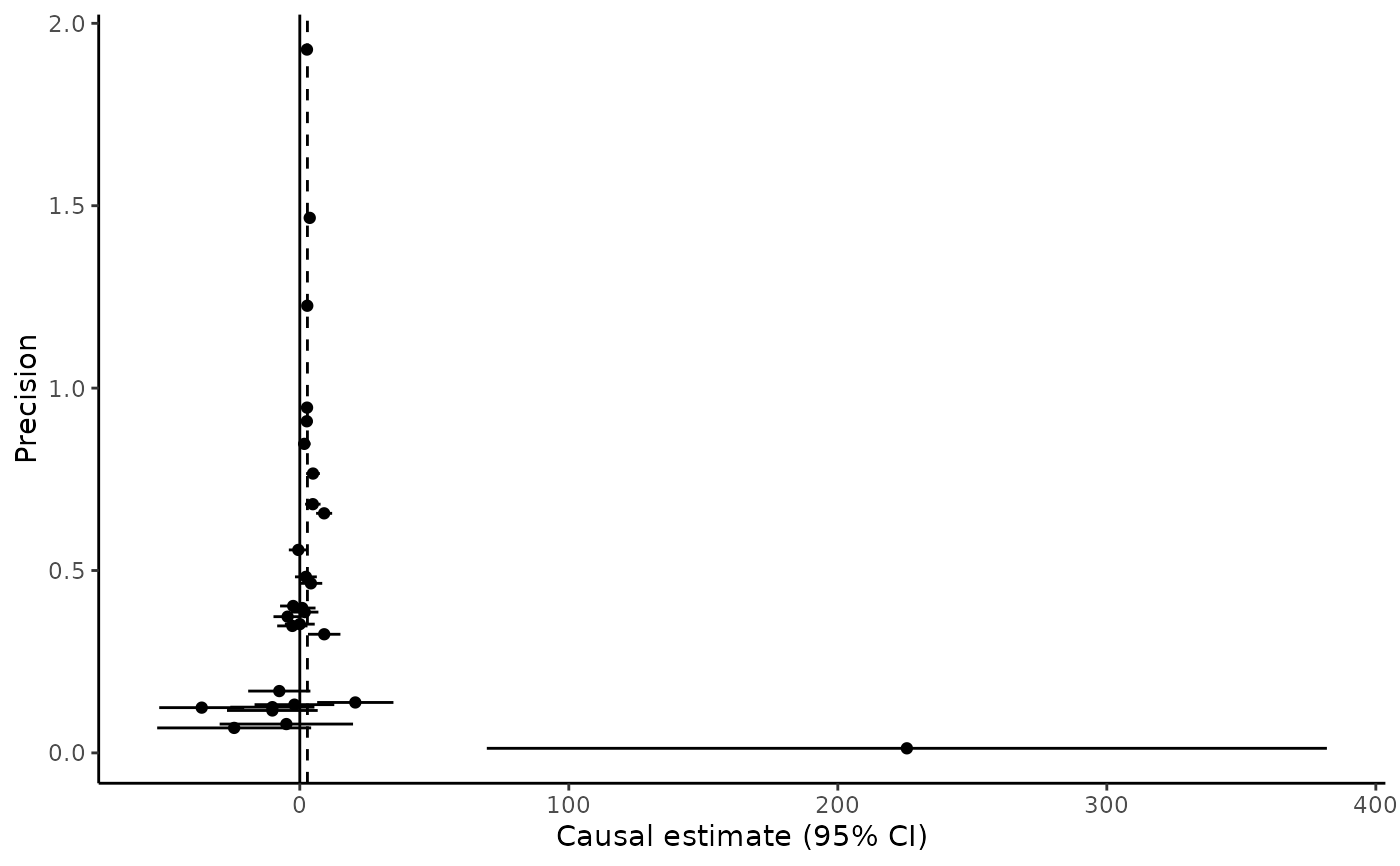
Draw a funnel plot of variant-specific estimates
Source:R/AllGenerics.R, R/mr_funnel-methods.R
mr_funnel.RdThe mr_funnel function draws a funnel plot of variant-specific causal estimates. Estimates (by/bx) are plotted against the precision of the estimates (abs(bx)/byse). Precision is the reciprocal of standard error. A vertical dashed line is plotted at the estimate from the mr_ivw function.
Arguments
- object
An
MRInputobject.- CI
A
logicalvariable dicating as to whether to plot the confidence interval associated with each point. Default value is TRUE.
Details
As the function produces a ggplot object, graphical parameters can be changed by adding commands from the ggplot2 package.
Examples
mr_funnel(mr_input(bx = ldlc, bxse = ldlcse, by = chdlodds, byse = chdloddsse))
